JavaFX provides a powerful set of Charts/Graphs that can be added very easily to your programs. Frankly, It is even easier than adding a Table in JavaFX. Graphical charts are available in the javafx.scene.chart package.
Bar Chart
This video describes how to add Bar Chart to your JavaFX program.
Bar Chart data can be represented using an XYChart.Series object. All that you have to do is to make a new object and add data to it.
XYChart.Series set1 = new XYChart.Series<>();
Data can be added to this set using the code. Here XYChart.Data() takes two parameters. First one is for the X-Axis(Horizontal) and the second one is for Y-Axis(Vertical).
set1.getData().add(new XYChart.Data("James", 5000));

set1.getData().add(new XYChart.Data("Alice", 10000));

set1.getData().add(new XYChart.Data("Alex", 2000));
Finally, Connect the created series with your JavaFX Bar Chart object using getData().addAll() method.
SalaryChart.getData().addAll(set1);
AddAll() method allows to add more than one series of data to your chart. For example if i have set1,set2 and set3 then i can add all of them by using a comma seperated list.
SalaryChart.getData().addAll(set1,set2,set3);
Pie Chart
JavaFX Pie Chart uses an ObservableList which is very similar to XYSeries.Series we used for Bar Chart. This video explains how to use pie chart.
ObservableList<PieChart.Data> pieChartData

= FXCollections.observableArrayList(

new PieChart.Data("Cars", 13),

new PieChart.Data("Bikes", 25),

new PieChart.Data("Buses", 10),

new PieChart.Data("Cycles", 22));

pieChart.setData(pieChartData);
Here i have created an ObservableList and added 4 values. The pie chart takes all of these values and allocate a percentage for each one.
For eg, Percentage of cars = 13/(13+25+10+22) = 18.5%
The data then can be associated with the chart using the same code used for Bar chart or using a simple alternative
pieChart.setData(pieChartData);
provided, pieChart is the Pie Chart object and pieChartData is the ObservableList.
Line Chart
Construction of Line Chart in Java is very much similar to Bar Chart. It takes the same XYChart.Series object.
XYChart.Series series = new XYChart.Series(); //Make a new XYChart object

//Add Data

series.getData().add(new XYChart.Data(“1”, 23));

series.getData().add(new XYChart.Data(“2”, 14));

series.getData().add(new XYChart.Data(“3”, 15));
Finally, associate the data with Line Chart.
LineChart.getData().addAll(series);
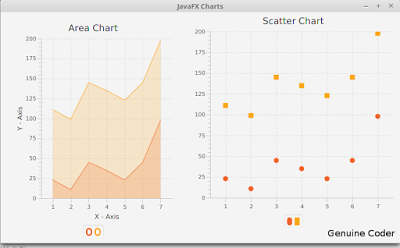
Area Chart and Scatter Chart
These two are explained together because, both of these Charts takes same type of data. Yes, the XYChart.Series object. We can use the same example used above.
XYChart.Series series = new XYChart.Series(); //Make a new XYChart object

//Add Data

series.getData().add(new XYChart.Data(“1”, 23));

series.getData().add(new XYChart.Data(“2”, 14));

series.getData().add(new XYChart.Data(“3”, 15));
Finally, associate the data with both charts.
 AreaChart.getData().addAll(series);

ScatterChart.getData().addAll(series);
So that’s how we add a chart /Graph to our JavaFX program and i hope you understood these things well enough.
———————————————————————————————–
Thanks to our sponsor
https://ksaexpats.com/